EnableAll logo
Back to Blog

How inaccessibility quietly drains your e-commerce revenue

Revenue

03 Mar 20265 mins

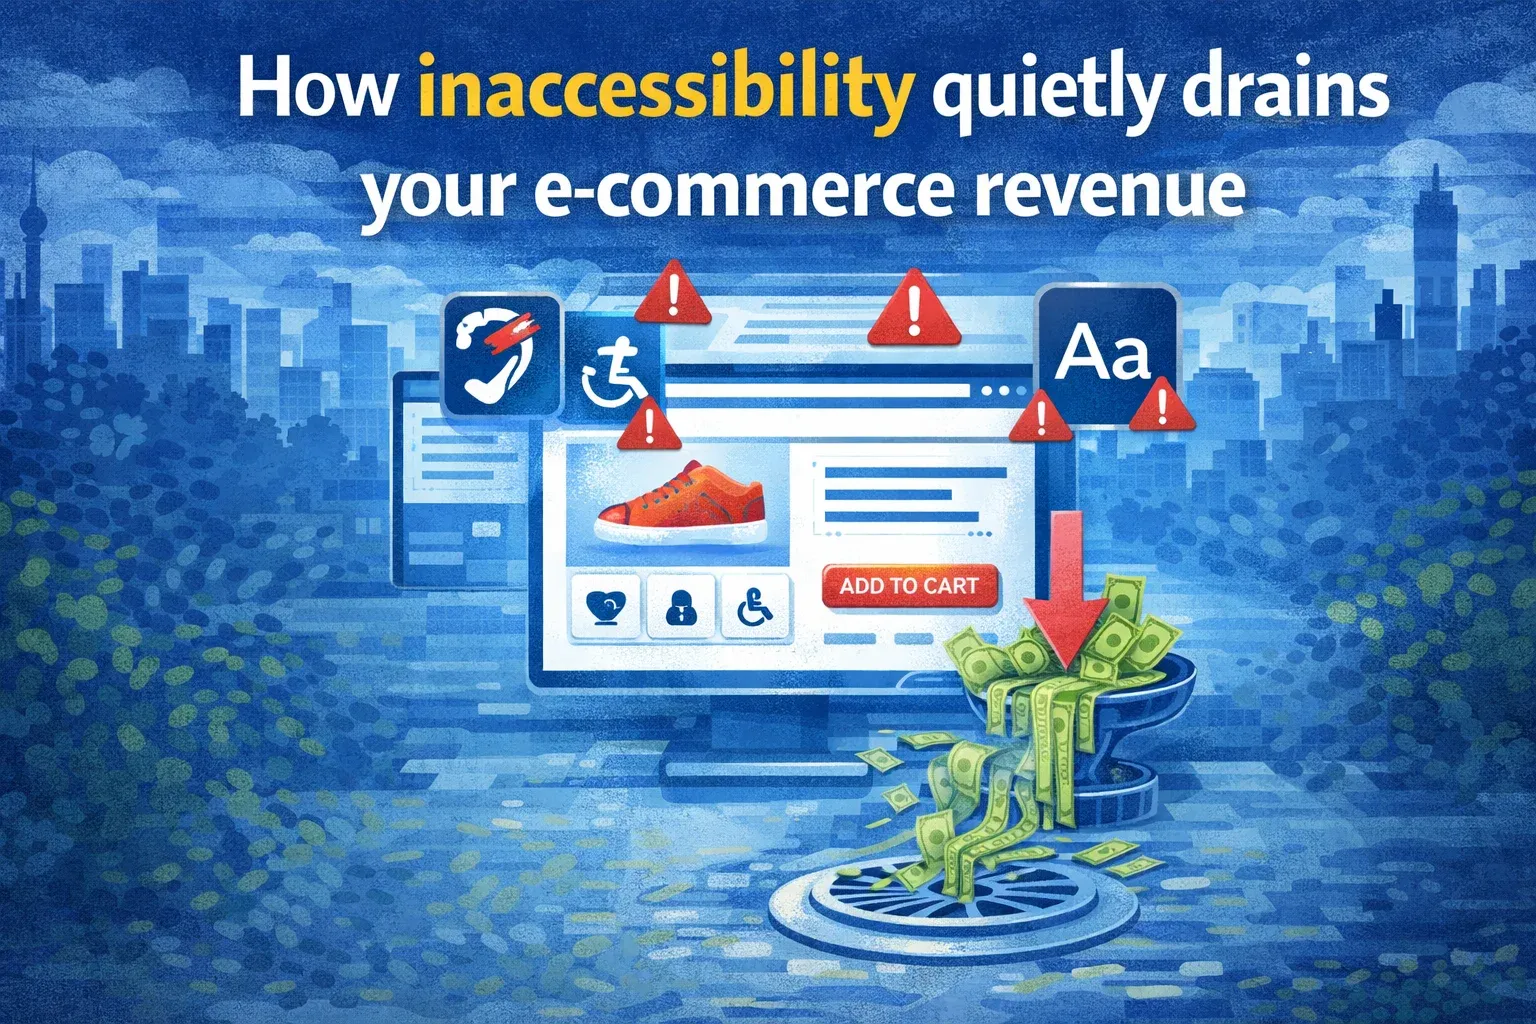
Illustration titled 'How inaccessibility quietly drains your e-commerce revenue', showing money draining from a store page.

Key takeaways

Accessibility barriers directly cost e-commerce businesses revenue, with 43% of disabled consumers abandoning purchases and U.S. businesses losing an estimated $6.9 billion annually.

You can calculate your exact loss by comparing conversion rates between sessions with accessibility signals and your baseline, then multiplying the gap by session volume and average order value.

Beyond recovering lost sales, fixing accessibility also cuts support costs, lowers acquisition costs, reduces cart abandonment, and limits costly legal exposure.

When the topic of accessibility comes up in your organization, it’s often framed as a legal requirement by the Legal team or a brand value issue by Marketing. But in digital commerce, accessibility is also a sales conversion problem, one that has a direct, measurable impact on revenue, so head’s up Sales team, this one’s for you.

The simple fact is, when customers can’t navigate, see, hear, or understand your site, they can’t buy. And when even a small portion of those customers encounter friction, the conversion gap grows. 43% of disabled consumers report abandoning an online or in-person shopping attempt because of accessibility obstacles according to Forbes. This ‘hidden revenue leak’ rarely makes it onto the P&L, but rest assured it’s costing you lost sales and abandoned carts. But how much? Let’s find out.

What the data already tells us

Industry estimates suggest that U.S. e-commerce businesses lose around $6.9 billion each year due to inaccessible websites and apps. That equates to roughly $493 in lost annual spending per disabled online customer.

But rather than debating that large, top-down number, let’s instead explore how to calculate the loss within your own company’s sales funnel. That’s where the conversion gap model comes in.

Step 1: define your baseline conversion rate

Start with your overall site or funnel average, for example, say a 3.0% conversion rate from sessions to purchase. This becomes your benchmark.

Step 2 identify accessibility-affected sessions

This step is critical, so take time to design it well. Look for signals that suggest a user may be encountering accessibility barriers. You do not need to know who has a disability, only which sessions might be affected by inaccessible design.

Practical, privacy-safe examples include:

·       Keyboard navigation patterns such as Tab and Shift + Tab with buttons triggered by Enter or Space

·       Use of a visible Skip to content link

·       Captions enabled in your video player or a reduced-motion preference recognized by your site

·       Repeated form-error submissions with focus moving to error messages

·       Unusually high retries or dwell time on address or payment fields

These “accessibility signals” form your flagged cohort. They are not perfect, and that’s fine, you are tracking possible friction, not identifying individuals.

Step 3 measure the conversion rate of that cohort

Suppose your overall conversion rate is 3.0 percent and the flagged cohort converts at 2.5 percent. The gap of 0.5 percentage points represents users who may be facing accessibility friction.

To estimate the impact, multiply that gap by the number of flagged sessions and your average order value. Even a small percentage difference can translate into a large amount of lost revenue.

Do that math

lost revenue = flagged sessions × (baseline CR – flagged CR) × AOV

Let’s say:

500,000 sessions per month show accessibility signals

Average order value (AOV): $80

Conversion gap: 0.5 percentage points (3.0% – 2.5%)

Lost orders per month: 500,000 × 0.005 = 2,500 lost orders

Revenue impact per month: 2,500 × $80 = $200,000

Annualized loss: $200,000 × 12 = $2.4 million per year

Yep, $2.4 million dollars. That’s a significant chunk of change. What’s more, that could be just one part of your firm’s funnel. Multiply across multiple entry points such as mobile app, guest checkout, and promo campaigns, and the total “accessibility tax” can become even larger.

Step 5: track improvement after fixes

Once accessibility issues are remediated:

•  Re-run the same analysis.

•  Track the conversion rate of the flagged cohort month over month.

•  Quantify regained conversions and revenue.

That’s your ROI on accessibility, in the same language that finance and leadership already understand.

Why this method works

• It uses your real traffic and conversion data, not generalized assumptions.

• It gives you a measurable before-and-after when the accessibility work ships.

• It aligns accessibility improvements with CRO and performance metrics.

• It builds a business case that satisfies both finance and compliance teams.

Share

In just a few clicks.

EnableAll accessibility widget icon
Facegym logo
Unhidden logo
BuDaGirl logo
Sabatino logo
Trend Tonic logo
Antler logo